Smart City Expo World Congress
On 17th and 18th of November, the “Smart City Expo World Congress” event is being held, instead of being at the Fira de Barcelona, this congress is an online format due to COVID-19 restrictions. Experts in new technologies from all over the world are participating in round-tables and presentations where it is being shown how the implementation of Smart Cities is contributing to the improvement of our community, from the educational field, the management of water resources, improving urban transport and especially in the monitoring of Air Quality to have tools to identify the main sources of pollution and make decisions to solve environmental pollution issues.
IoT Smart Spot, devices as allies against Climate Change
HOPU, as a company specialized in the design of innovative urban solutions through the latest technologies such as Artificial Intelligence, Internet of Things and data quality, has extensive experience in the development of solutions for the administration to know in real time data related to air quality such as gases (CO, O3, NO2, SO2), PM1, PM2.5 and PM10 particles, noise and meteorological values such as temperature and humidity, atmospheric pressure, wind speed and direction, weather forecast, among others.
Our IoT Smart Spot devices are an ally of the administration to fight against Climate Change since it allows to unify in a single device all sensors, customizing their configuration according to specific needs, saving costs and allowing the city to obtain accurate data of the location of the sensor as the overall AQi state of the city.
Smart Spot devices also include sensors and tools that are very useful in Smart City projects, such as monitoring the influx of people in real time through BLE technology, being able to anticipate crowds and obtain data of visits to tourist areas, shopping streets, etc.
Our solution is based on open source software that allows direct integration into Smart platforms such as FIWARE and SENTILO, uniting all verticals in a single management and visualization tool, making it easier for those responsible to obtain a global vision of the city’s Smart project.
Visualization tool: know the state of the city at a glance
Through our visualization tool, the values of gases, PM particles, noise, meteorological and influx of people are shown on a single screen to obtain a complete view of the city, being able to also know the values corresponding to a specific sensor by its location on map.
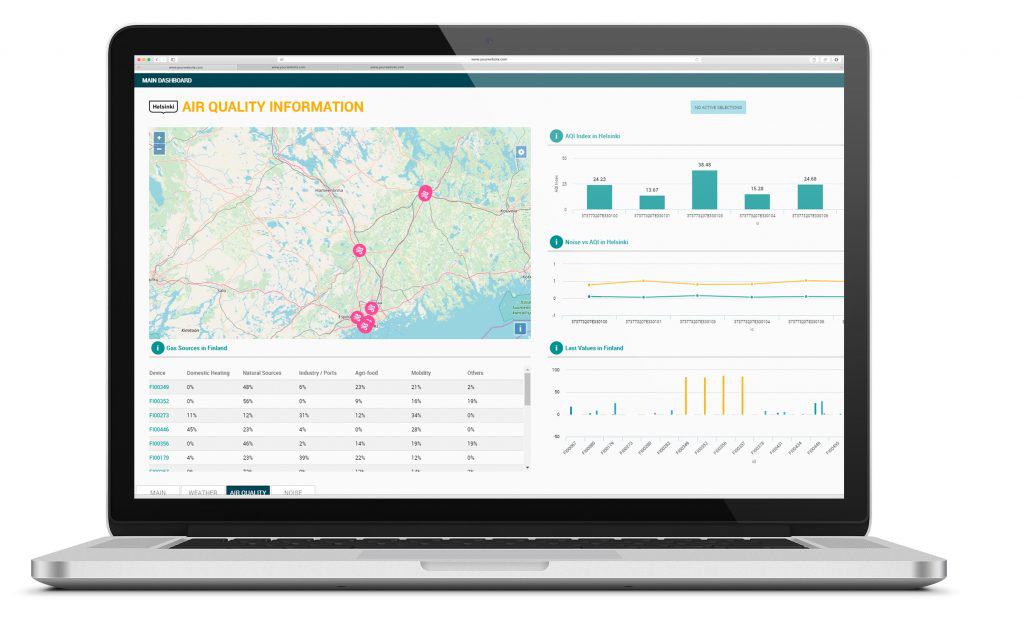
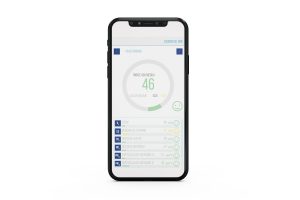
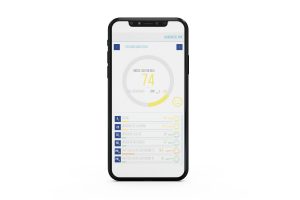
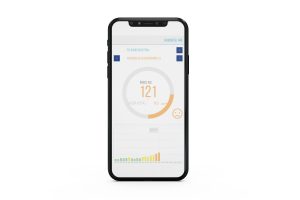
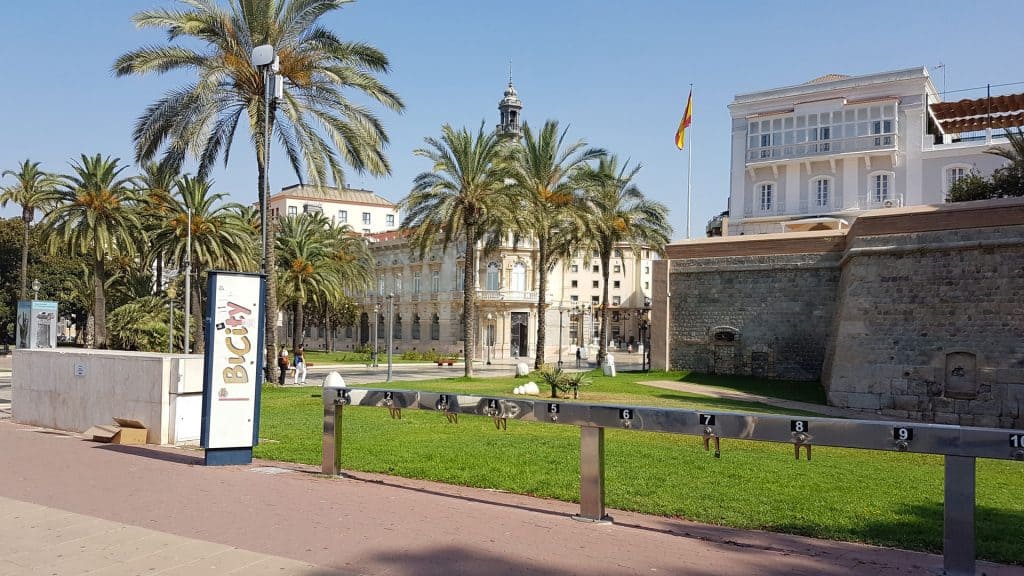
This visualization service is already offered in municipalities such as Cartagena, La Palma, Mechelen and Helsinki, among others where the population knows in real time factors such as exposure to PM1, PM2.5 and PM10 particles, pollen concentrations, NO2, CO, O3, SO2… and noise levels, among others. Thanks to a traffic light viewer, the population has a tool with which they can easily know, through graphics, the air quality of their municipality as a whole.
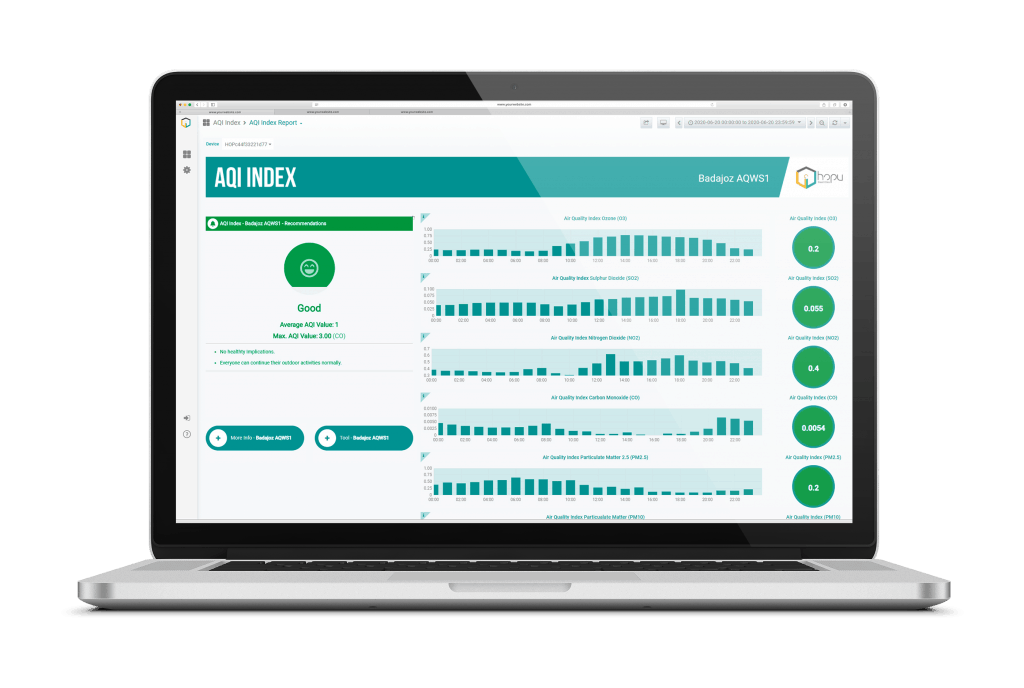
The AQi data visualization platform is customizable to consult both through a web page, mobile application, information screens of the city, notifications through telegram and / or whatsapp… facilitating its consultation to the population regardless of their level of use of new technologies.